Workforce Performance Measuring Software: What It
Is and What It Actually Measures
2026-09-23
•
Author: TrackForce Team
•
~1 min read
•
Updated September 23, 2026
- What Is Workforce Performance Measuring Software?
- Workforce Analytics Software vs Performance Management Software
- The Four Layers of Workforce Measurement
- What Workforce Analytics Software Actually Measures
- —1. Work time and attendance
- —2. Active and idle time
- —3. Application and website usage
- —4. Workload distribution
- —5. Workflow and time allocation
- —6. Trends, exceptions and risk signals
- What the Software Does Not Measure by Itself
- A Practical Workforce Performance Scorecard
- How to Use Workforce Analytics Without Micromanaging
- —Define the decision before collecting the data
- —Tell employees what is measured and why
- —Review teams and trends before isolated moments
- —Combine analytics with outcome data and conversation
- —Restrict access and retain an audit trail
- What to Look for in Workforce Analytics Software
- Measure Work to Improve It, Not Just to Watch It
- Frequently Asked Questions
- —What is workforce analytics software?
- —Does workforce analytics software measure productivity?
- —What workforce productivity metrics should a company track?
- —Is active time the same as productive time?
- —How can companies use employee analytics fairly?
Your dashboard says one employee was active for six hours and another for four. Did the first person perform better?
Not necessarily. The second employee may have solved a harder problem, completed more valuable work or spent two legitimate hours in meetings, research or offline review. Activity is measurable. Performance is a conclusion that needs context.
This is the central issue with workforce performance measurement. Software can collect accurate signals about time, activity, applications, websites, attendance and workload. It can reveal patterns that managers would otherwise miss. But it cannot turn every mouse movement into productivity or replace the quality, quantity, timeliness and business value of the work itself.
The best workforce analytics software makes that distinction clear. It gives managers reliable evidence for better questions—not an automatic verdict on an employee.
This guide explains what the software captures, what those metrics can and cannot tell you, and how to build a fair measurement system.
What Is Workforce Performance Measuring Software?
Workforce performance measuring software collects data about how work happens across employees, teams, devices, applications and schedules. It converts operational events into reports and trends about attendance, workload, tool usage and workflow friction.
Depending on the platform and configuration, it may capture:
- clock-in, clock-out and total tracked time;
- active time, idle periods and breaks;
- application and website usage;
- tasks, projects and time allocation;
- screenshots or screen recordings;
- search, file or meeting activity;
- device and user activity;
- daily, monthly, team and risk reports.
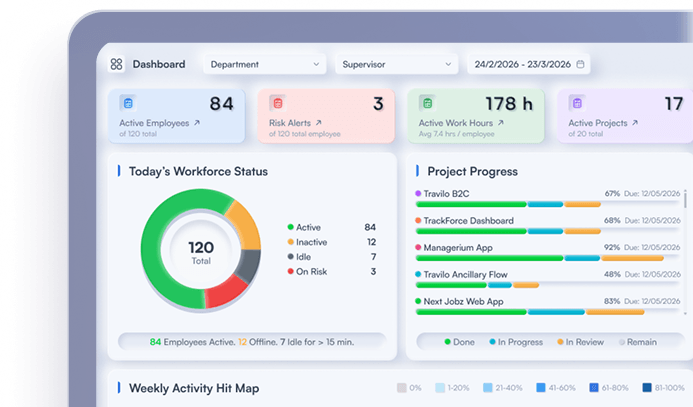
TrackForce combines time and activity tracking, application and website insights, workload reporting, employee management and role-based access in one system. Its product positioning is deliberately broader than screen monitoring: the goal is real-time work visibility and better workflow decisions rather than simply proving that a device was active.
A timesheet records hours. Analytics connects those hours with patterns, tools, tasks, teams and trends.
Workforce Analytics Software vs Performance Management Software
These categories overlap, but they are not identical.
Workforce analytics software observes operational signals: when work happened, where time went, which tools were used, how activity changed and where workloads may be uneven.
Performance management software manages goals, reviews, feedback, ratings and development plans. It asks whether agreed outcomes were achieved.
Workforce management software commonly covers scheduling, attendance, labor planning and timekeeping.
A business may use data from all three. The important point is that activity analytics should inform performance conversations, not silently become the entire performance score.
The U.S. Office of Personnel Management's performance measurement guidance describes performance through measures such as quality, quantity, timeliness and cost-effectiveness. Device activity can provide context for some of those measures, but it rarely represents all four.
The Four Layers of Workforce Measurement
A useful way to understand workforce analytics is to separate what the system records from what the organization ultimately cares about.
| Layer | Examples | What it tells you |
| 1. Presence | Clock-in, clock-out, attendance, breaks | When a person was available or recorded as working |
| 2. Activity | Active time, idle time, apps, websites, screenshots | What happened on a monitored device during tracked time |
| 3. Workflow | Task time, workload distribution, tool switching, recurring delays | How work moves and where a process may be inefficient |
| 4. Outcomes | Completed work, quality, timeliness, customer result, revenue or cost | Whether the work achieved its intended result |
Most monitoring platforms are strongest in the first two layers. Good workforce analytics connects them to the third. The fourth layer normally requires data from project, CRM, service, quality or business systems—plus managerial judgment.
Problems begin when a company takes a layer-two metric, such as active time, and treats it as a layer-four outcome, such as employee value.
What Workforce Analytics Software Actually Measures
1. Work time and attendance
Time data answers basic operational questions: When did work start? When did it stop? How many hours were tracked? Were there recurring late starts, early finishes or unusually long sessions?
This can support attendance reviews, payroll inputs, capacity planning and compliance recordkeeping. In the United States, the Department of Labor notes that covered employers must keep accurate records for certain non-exempt employees' hours and wages, although the applicable rules depend on worker type and jurisdiction. Its recordkeeping guidance allows different timekeeping methods as long as the information is complete and accurate.
What time data does not show is how difficult the work was or whether it was completed well. Eight tracked hours are an input, not an outcome.
2. Active and idle time
Active time usually reflects configured keyboard, mouse or device interaction. Idle time reflects a period without that detectable activity.
These metrics can highlight patterns: a recurring system delay, extended inactivity, unusually fragmented days or teams spending far more time than expected in an operational process. They are useful for investigation and workflow design.
They are not direct productivity measures. Reading, planning, reviewing printed material, speaking with a customer or thinking through a technical problem may produce little input activity. High active time can also reflect repetitive work, inefficient processes or avoidable tool switching.
Use active and idle time as a signal to ask “what is happening here?” rather than a score that says “good” or “bad.”
3. Application and website usage
Application and website analytics show which digital tools consume working time. Depending on configuration, the report may include the application or domain, duration, visit count, active window and employee or team.
This data can reveal:
- duplicate tools performing the same job;
- heavy switching between systems;
- a slow browser-based workflow;
- underused software licenses;
- teams relying on unapproved tools;
- training or process-standardization opportunities.
Context is critical. Social platforms may be essential for a marketing team, video sites may host training material, and documentation websites may be central to development. Labels such as “productive” and “unproductive” should be role-specific, reviewable and used carefully.
TrackForce's guide to employee activity monitoring software explores why activity becomes useful only when it sits beside tasks, projects and workload.
4. Workload distribution
Workload analytics compares patterns across people, projects or teams. It can show one employee consistently working longer hours, a department accumulating idle periods, or a project consuming more time than planned.
That does not automatically identify the cause. The pattern may result from uneven task assignment, missing training, technical problems, unclear requirements, a high-complexity account or an unrealistic deadline.
The managerial value is early visibility. Instead of discovering burnout or delay after a deadline is missed, a team lead can investigate while the work is still moving.
5. Workflow and time allocation
When time, applications and task context are connected, workforce reporting can reveal how a process works in practice rather than how it appears in a procedure document.
Managers may find that employees re-enter the same information, wait for approvals, switch repeatedly between tools or spend disproportionate time on routine administration. Those findings can support automation, clearer ownership or a redesigned workflow.
This is one of the strongest uses of workforce analytics because it measures the system around the employee—not just the employee inside the system.
6. Trends, exceptions and risk signals
Daily or monthly reports can show whether patterns are stable, improving or declining. Exception reports may surface sudden changes, unusual access, repeated policy violations or activity outside expected hours.
A trend is more reliable than one isolated event, but it still needs validation. A system update, timezone error, device problem, approved overtime or changed role can create an unusual pattern. Alerts should trigger review, not automatic punishment.
What the Software Does Not Measure by Itself
Workforce analytics software does not automatically measure:
- the quality or accuracy of a finished deliverable;
- the difficulty or complexity of an assignment;
- creativity, judgment or problem-solving value;
- customer satisfaction unless customer data is connected;
- revenue or cost impact unless business systems are connected;
- teamwork, coaching or knowledge sharing;
- whether a meeting, document or decision was useful;
- the reason behind an activity pattern.
It may support these evaluations by providing evidence, but it cannot prove them alone.
For example, a support agent's application time becomes more meaningful beside tickets resolved, reopen rate and customer satisfaction. A developer's tracked hours need delivery, defect and review context. A finance employee's throughput needs accuracy and control quality. Each role requires outcome measures that reflect the work.
A Practical Workforce Performance Scorecard
Avoid building one universal productivity number. Use a balanced scorecard with different evidence types.
| Measurement area | Useful examples | Source |
| Time and availability | Hours, attendance, schedule adherence | Workforce analytics |
| Work patterns | Active/idle trends, task time, tool usage | Workforce analytics |
| Quantity | Cases completed, calls handled, deliverables shipped | Operational system |
| Quality | Error rate, rework, audit result, customer rating | Quality or service system |
| Timeliness | Deadline attainment, response time, cycle time | Project or workflow system |
| Business impact | Revenue, cost, retention, risk reduction | CRM, finance or business reporting |
| Context | Complexity, blockers, training, collaboration | Manager and employee review |
The weighting should differ by role. Quantity may matter for a transaction-processing team; quality and timeliness may matter more for compliance work. A manager should document the standard before using data to evaluate people.
How to Use Workforce Analytics Without Micromanaging
Define the decision before collecting the data
Start with a business question: reduce missed deadlines, balance workload, improve time records or identify workflow bottlenecks. Then collect only the information necessary for that purpose.
Tell employees what is measured and why
Explain the data collected, when monitoring operates, who can access reports, how long information is retained and how it may affect decisions. Give employees a way to correct or explain misleading data.
The UK Information Commissioner's Office advises that worker monitoring should be lawful, fair, transparent, necessary and proportionate. Its worker-monitoring guidance also warns that analytics can make incorrect inferences, particularly when data is used for potentially adverse decisions. Requirements differ by country, so obtain appropriate legal or HR guidance for your workforce.
Review teams and trends before isolated moments
A weekly pattern is usually more useful than a single screenshot or idle period. Aggregate views can reveal workload and process problems without requiring managers to inspect every action.
Combine analytics with outcome data and conversation
If activity changes, ask what changed in the work. Compare the signal with assignments, output, quality and employee explanation. Data should make the conversation more specific, not remove the conversation.
For distributed teams, TrackForce's guide to remote employee monitoring provides a practical framework for maintaining visibility without turning management into constant surveillance.
Restrict access and retain an audit trail
Detailed employee data should be available only to people with a legitimate role. Role-based permissions, defined retention and an auditable review process reduce misuse and strengthen employee trust.
What to Look for in Workforce Analytics Software
When evaluating a platform, ask whether it can:
- separate work time, active time, idle time and breaks;
- report by employee, team, project and period;
- show application and website trends with role-specific context;
- connect workload and task information to activity data;
- control screenshots and detailed monitoring by policy;
- restrict access through roles and permissions;
- preserve accurate timestamps and exportable reports;
- help employees review or explain their data;
- support the devices and work models your teams use;
- turn patterns into decisions without forcing one opaque productivity score.
Test the software with a real management question. Ask the vendor to show how you would identify an overloaded team, investigate a delayed project and distinguish a process problem from an individual performance issue.
TrackForce is designed around that visibility model. Its centralized platform combines automatic time and activity tracking, productivity trends, application and website insights, workload reporting, customizable monitoring controls and role-based access. The related guide to employee monitoring with time tracking shows how those components work together.
Measure Work to Improve It, Not Just to Watch It
Workforce performance measuring software is valuable because it replaces guesswork with evidence. It can show when work happens, how time is distributed, which tools dominate the day and where patterns suggest a workflow or workload problem.
Its limit is equally important: activity is not the same as achievement. Strong workforce measurement connects presence, activity and workflow data to role-specific outcomes—then adds fair human review.
That is the standard buyers should expect from workforce analytics software: enough visibility to improve work, enough context to avoid false conclusions and enough control to use employee data responsibly.
Ready to understand how work moves across your team? Explore TrackForce or review its pricing and 30-day trial options to see how time, activity and workforce reporting can support better decisions.
Frequently Asked Questions
What is workforce analytics software?
Workforce analytics software collects and organizes data about working time, activity, applications, websites, attendance, workload and trends. Managers use it to identify patterns and support operational decisions.
Does workforce analytics software measure productivity?
It measures signals related to productivity, such as time allocation, activity and workflow patterns. It does not independently prove the quality, value or business outcome of the work. Those require role-specific outcome data and context.
What workforce productivity metrics should a company track?
Choose metrics that match the role and business goal. A balanced set may include time and attendance, workload, quantity, quality, timeliness, customer results, cost and employee context.
Is active time the same as productive time?
No. Active time generally indicates device interaction. Productive work can happen with little keyboard or mouse activity, while high activity can occur during inefficient or low-value work.
How can companies use employee analytics fairly?
Define a legitimate purpose, collect only necessary data, communicate clearly, limit access, validate accuracy, let employees provide context and avoid making high-impact decisions from one metric alone. Verify the employment and privacy laws that apply in each jurisdiction.
Similar blog you can explore
Employee Performance Metrics: The 9 That Predict Results
How to Improve Work Performance: 12 Changes That Hold
Workforce Analytics vs Employee Monitoring: Where the Line Sits
Start Your 30-Day
Free TrackForce Trial